
I recently had the chance to become one of the first people outside of Cisco to setup and configure the CMX to Elasticsearch Connector. Being one of the first meant that the install instructions were not the best, in fact some steps didn’t work at all.
The real benefit of being able to automatically have CMX data collected exported to Elasticsearch for analytical processing, the benefit of using elasticsearch over CMX’s built in reports is the ability to bring in other data sources to cross reference wireless data fields such as username.
Cisco released both a direct connector to elasticsearch and also splunk, I choose to test out the elasticsearch one first.
Below are the steps that I followed to get the Connector passing data from CMX to an Elasticsearch server.
Deploy Linux system (RHEL6/7 or Centos 6), I used a RHEL7 deployment.
Deployment environment setup on Linux Environment
Run Command:
$curl --silent --location https://rpm.nodesource.com/setup | bash -
if not logged in as root then:
$curl --silent --location https://rpm.nodesource.com/setup | sudo bash -
Following the Cisco Documentation displays a Deprecation Warning:
The install command below didn’t work on the deprecated version so I downloaded it using the following command
$curl --silent --location https://rpm.nodesource.com/setup_6.x | sudo bash -
The command cisco provided didnt work so I used the following
$sudo yum install -y gcc-c++ make
$curl -sL https://rpm.nodesource.com/setup_6.x | sudo -E bash -
Install nodejs and npm
$sudo yum –y install nodejs
Verify nodejs and npm are installed by running the following command
$ node –v
$ npm –v
I returned
Downloading and installing Elasticsearch
Now install Java:
$sudo yum install java-1.8.0-openjdk.x86_64
Confirm Java Version:
Install elasticsearch. Use the following URL to install the latest version.
https://www.elastic.co/downloads/elasticsearch
Copy link address of the TAR file as shown below. This link address is copied in “sudo wget” command next.
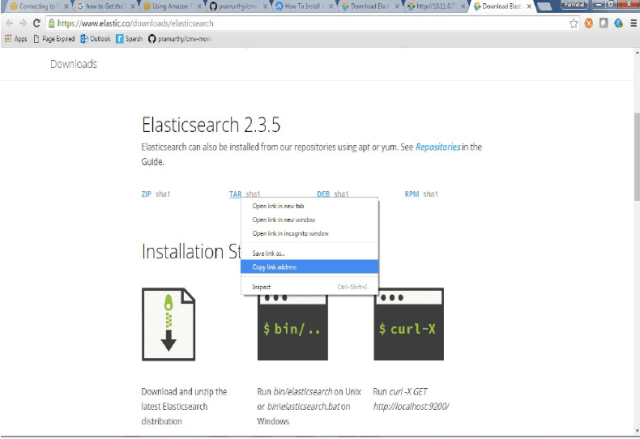
sudo wget https://download.elastic.co/elasticsearch/release/org/elasticsearch/distribution/tar/elasticsearch/2.4.1/elasticsearch-2.4.1.tar.gz
tar xvzf elasticsearch-2.4.1.tar.gz
cd elasticsearch-2.4.1
Start elasticsearch. (do not use root permission)
$ nohup ./bin/elasticsearch &
Installing Kibana (optional but required if you want visual)
Create and edit a new yum repository file for Kibana:
$ sudo vi /etc/yum.repos.d/kibana.repo
Us vi commands to insert and save following:
[kibana-4.4]
name=Kibana repository for 4.4.x packages
baseurl=http://packages.elastic.co/kibana/4.4/centos
gpgcheck=1
gpgkey=http://packages.elastic.co/GPG-KEY-elasticsearch
enabled=1
Install Kibana:
$ sudo yum -y install kibana
Start Kibana
$ cd /opt/kibana
$ nohup ./bin/kibana &
Refer this URL for more details: https://www.digitalocean.com/community/tutorials/how-to-install-elasticsearchlogstash-and-kibana-elk-stack-on-centos-7
Installing CMX Collector
Download cmx-monitor-master.zip (zip file / tar file) from the link provided (Currently not released to public)
SCP the file to the Elasticsearch box:
$scp cmx-monitor-master.zip hand0001@corp-cmx02-v20.ocio.monash.edu:cmx.zip
Install unzip (if required)
$sudo yum install unzip
Untar/unzip the “cmx-monitor-master”
$ unzip cmx.zip
Create a project directory “cmx” and move the files appropriately to this project directory.
Make sure following files are extracted from above zip/tar file and copied into project directory (“cmx”)
- Main.js
- analyticdata.js
- clientdata.js
- mapdata.js
- notificationdata.js
- config.js
- cmxToken.js
- cmxUtil.js
- credentials.json
- loglevel.json
$cd cmx-monitor-master/
$mv cmx ..
$ls
$cd cmx
$ls
Install npm.
$ npm install elasticsearch
$ npm install express
$ npm install request
$ npm install body-parser
$ npm install log4js
$ npm install q
Verify that “cmx” directory has a new folder “node_modules”.
$ls
CMX-Elastic connector application will be started to run in the background as a “forever” service.
Install forever command to run application continuously (in the background) from project directory “cmx”.
$ sudo npm install forever –g
Refer to the link to view more details on “forever” https://www.npmjs.com/package/forever
Configuring CMX Collector settings
Edit the config.js file (To be updated with working file)
$ vi config.js
Add the CMX credentials to the credentials.json file
$ vi credentials.json
Notification setup in CMX server
Log on to CMX server with the appropriate login credentials.
Navigate from “Mange” from the top menu bar to “Notifications” and select “+New Notification”
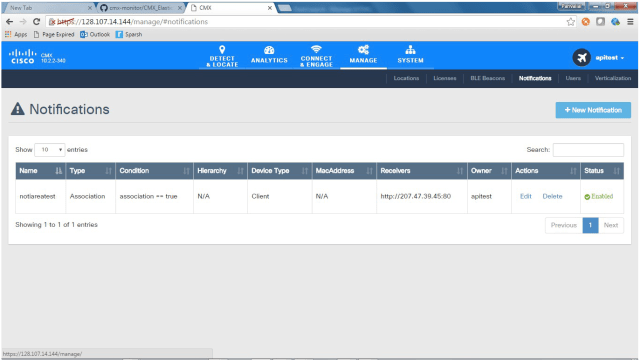
Fill the notification name, select the type (drop-down) of the notification, and enter the host IP address and port number; IP address & port number shall be your listener software module where it is running to receive the CMX notification data. URL shall be entered same as what is given in the config.js. Refer to section “Configuring CMX Collector Settings”. Enable the notifications after you start the CMX Collector as explained in the next section.
NOTE: Cisco’s documentation said to select type In/Out but it didn’t work, I have managed to get the “Location Update” type to work.

Running CMX Collector for Elasticsearch
To start CMX Collector running in background
$ sudo forever start -c node main.js
Verify CMX Collector is running in forever mode using “forever list” command. Verify that the list shows a process “node main.js” is running.
$ sudo forever list
To stop CMX Collector running in forever mode, use “forever stop” command as below
$ sudo forever stop main.js
OR
$ sudo forever stopall (this command will stop all processes in forever)
Log file created by “forever” is located at /root/.forever/xxx.log w.r.t forever tool issues. CMX collector logs are stored in ./logs/cmxLog.log
Kibana – Index creation for CMX connector
Go to “Settings” to configure an index pattern in Kibana. (refer below picture)
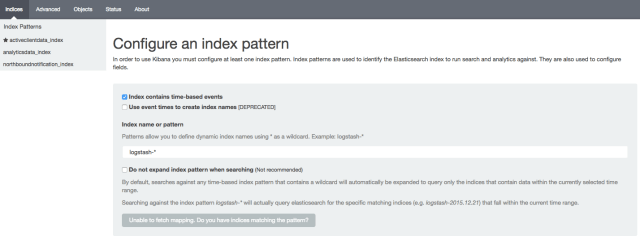
- Enter the index name under under index name or Pattern (eg. “mapdata_index” OR “activeclientdata_index” OR “analyticsdata_index” OR “northboundnotification_index”)
- Select Time field name from drop-down list – elk_timestamp
- Click / Select “Create” button to create the index
- Repeat the above steps to create multiple index
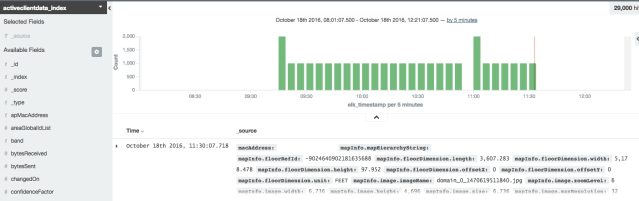
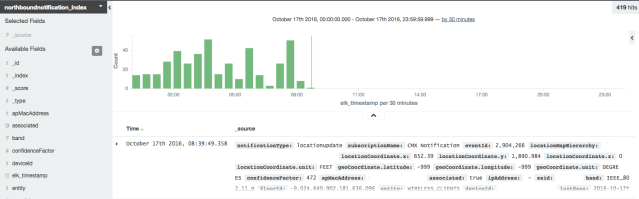
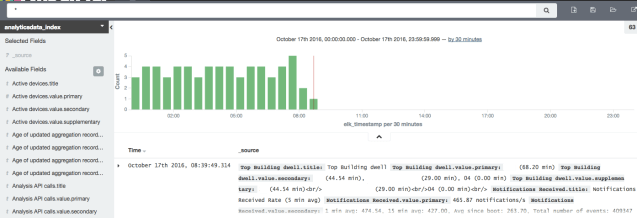
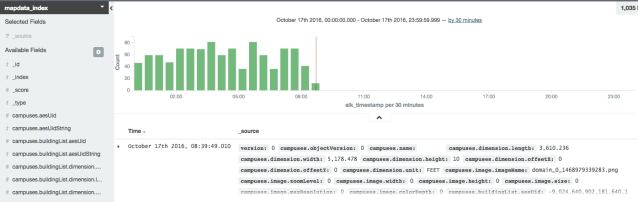
You will Get the following index tables (NOTE that it took nearly 24 hours for my activeclientdata_index to populate – Cisco advised me that this should happen straight away
Activeclientdata_index
northboundnotification_index
analyticsdata_index
mapdata_index
Verification from Linux Box:
Verify that Kibana is running
$ps -afe | grep kibana
Verify that Kibana is running
$ps -afe | grep elastic
TROUBLESHOOTING
CAN’T ADD INDEXES TO KIBANA
First run
$ sudo forever stop main.js
Then delete the index that you can’t add
$curl -XDELETE 'http://localhost:9200/northboundnotification_index'
$curl -XDELETE 'http://localhost:9200/activeclientdata_index'
$curl -XDELETE 'http://localhost:9200/analyticsdata_index'
$curl -XDELETE 'http://localhost:9200/mapdata_index'
following deleting the indexes run
$sudo forever start -c node main.js
Confirming Data being feed into Indexes
To confirm if the index is actually receiving data run the following command:
$curl 'localhost:9200/_cat/indices?v'
In the above example you can see the activeclientdata_index is not collecting data. The example below shows it collecting:
yellow open northboundnotification_index 5 1 2346288 0 1008.3mb 1008.3mb
My next CMX connector to attempt will be to Splunk, I am just waiting on Cisco BU to work out why it has taken 24 hours for the activeclientdata_index to populate or advise that this is normal before I close off this test.

Pingback: CMX to Splunk Connector – THE WLAN
hi,
what value did you specify for the following variable? we are implementing in our environment, and can not find documentation that specifies what this value should be.
/* Elasticsearch URL in CMX Server */
module.exports.CMX_ELASTICSEARCH_URL = “”;
LikeLike
Hi Joe
To tell you the truth I cant remember
I believe I left it blank.
I have asked Cisco about it and the official word is that they are not supporting this Connector and it will be left up to the community for support.
The connector and the install instructions (although if you have used mine you will have done 100% of them) are located:
https://cisco.app.box.com/s/6lllxua1smz70xtdak5um52d63un9pch
LikeLike